
Thematic Analysis
Published in Personal Website, 2025
Network Analysis
I conducted a cluster analysis on my manuscripts to assist in writing my research statement by identifying themes and tracking the evolution of my work. I identified 21 themes and classified their presence in each manuscript. The table below lists these themes along with their node strength, which indicates the total number of AND values for each theme across all papers. The adjacency matrix represents the cross-product of the boolean matrix for thematic endorsement across all manuscripts. The data here are available here, and the R code is accessible here.
| Theme | Node Strength |
| neuroimaging | 87 |
| developmental | 91 |
| data.quality | 61 |
| psychopathology | 68 |
| cognition | 21 |
| methods | 64 |
| item.response.theory | 40 |
| model.convergence | 62 |
| bayesian | 36 |
| substance.use | 11 |
| time.series | 19 |
| panel.data | 19 |
| environment | 66 |
| adversity | 49 |
| ordinal.data | 67 |
| structural.neuroimages | 65 |
| functional.neuroimages | 37 |
| measurement | 59 |
| analytic.technique | 65 |
| nonparametric | 59 |
| multilevel.model | 70 |
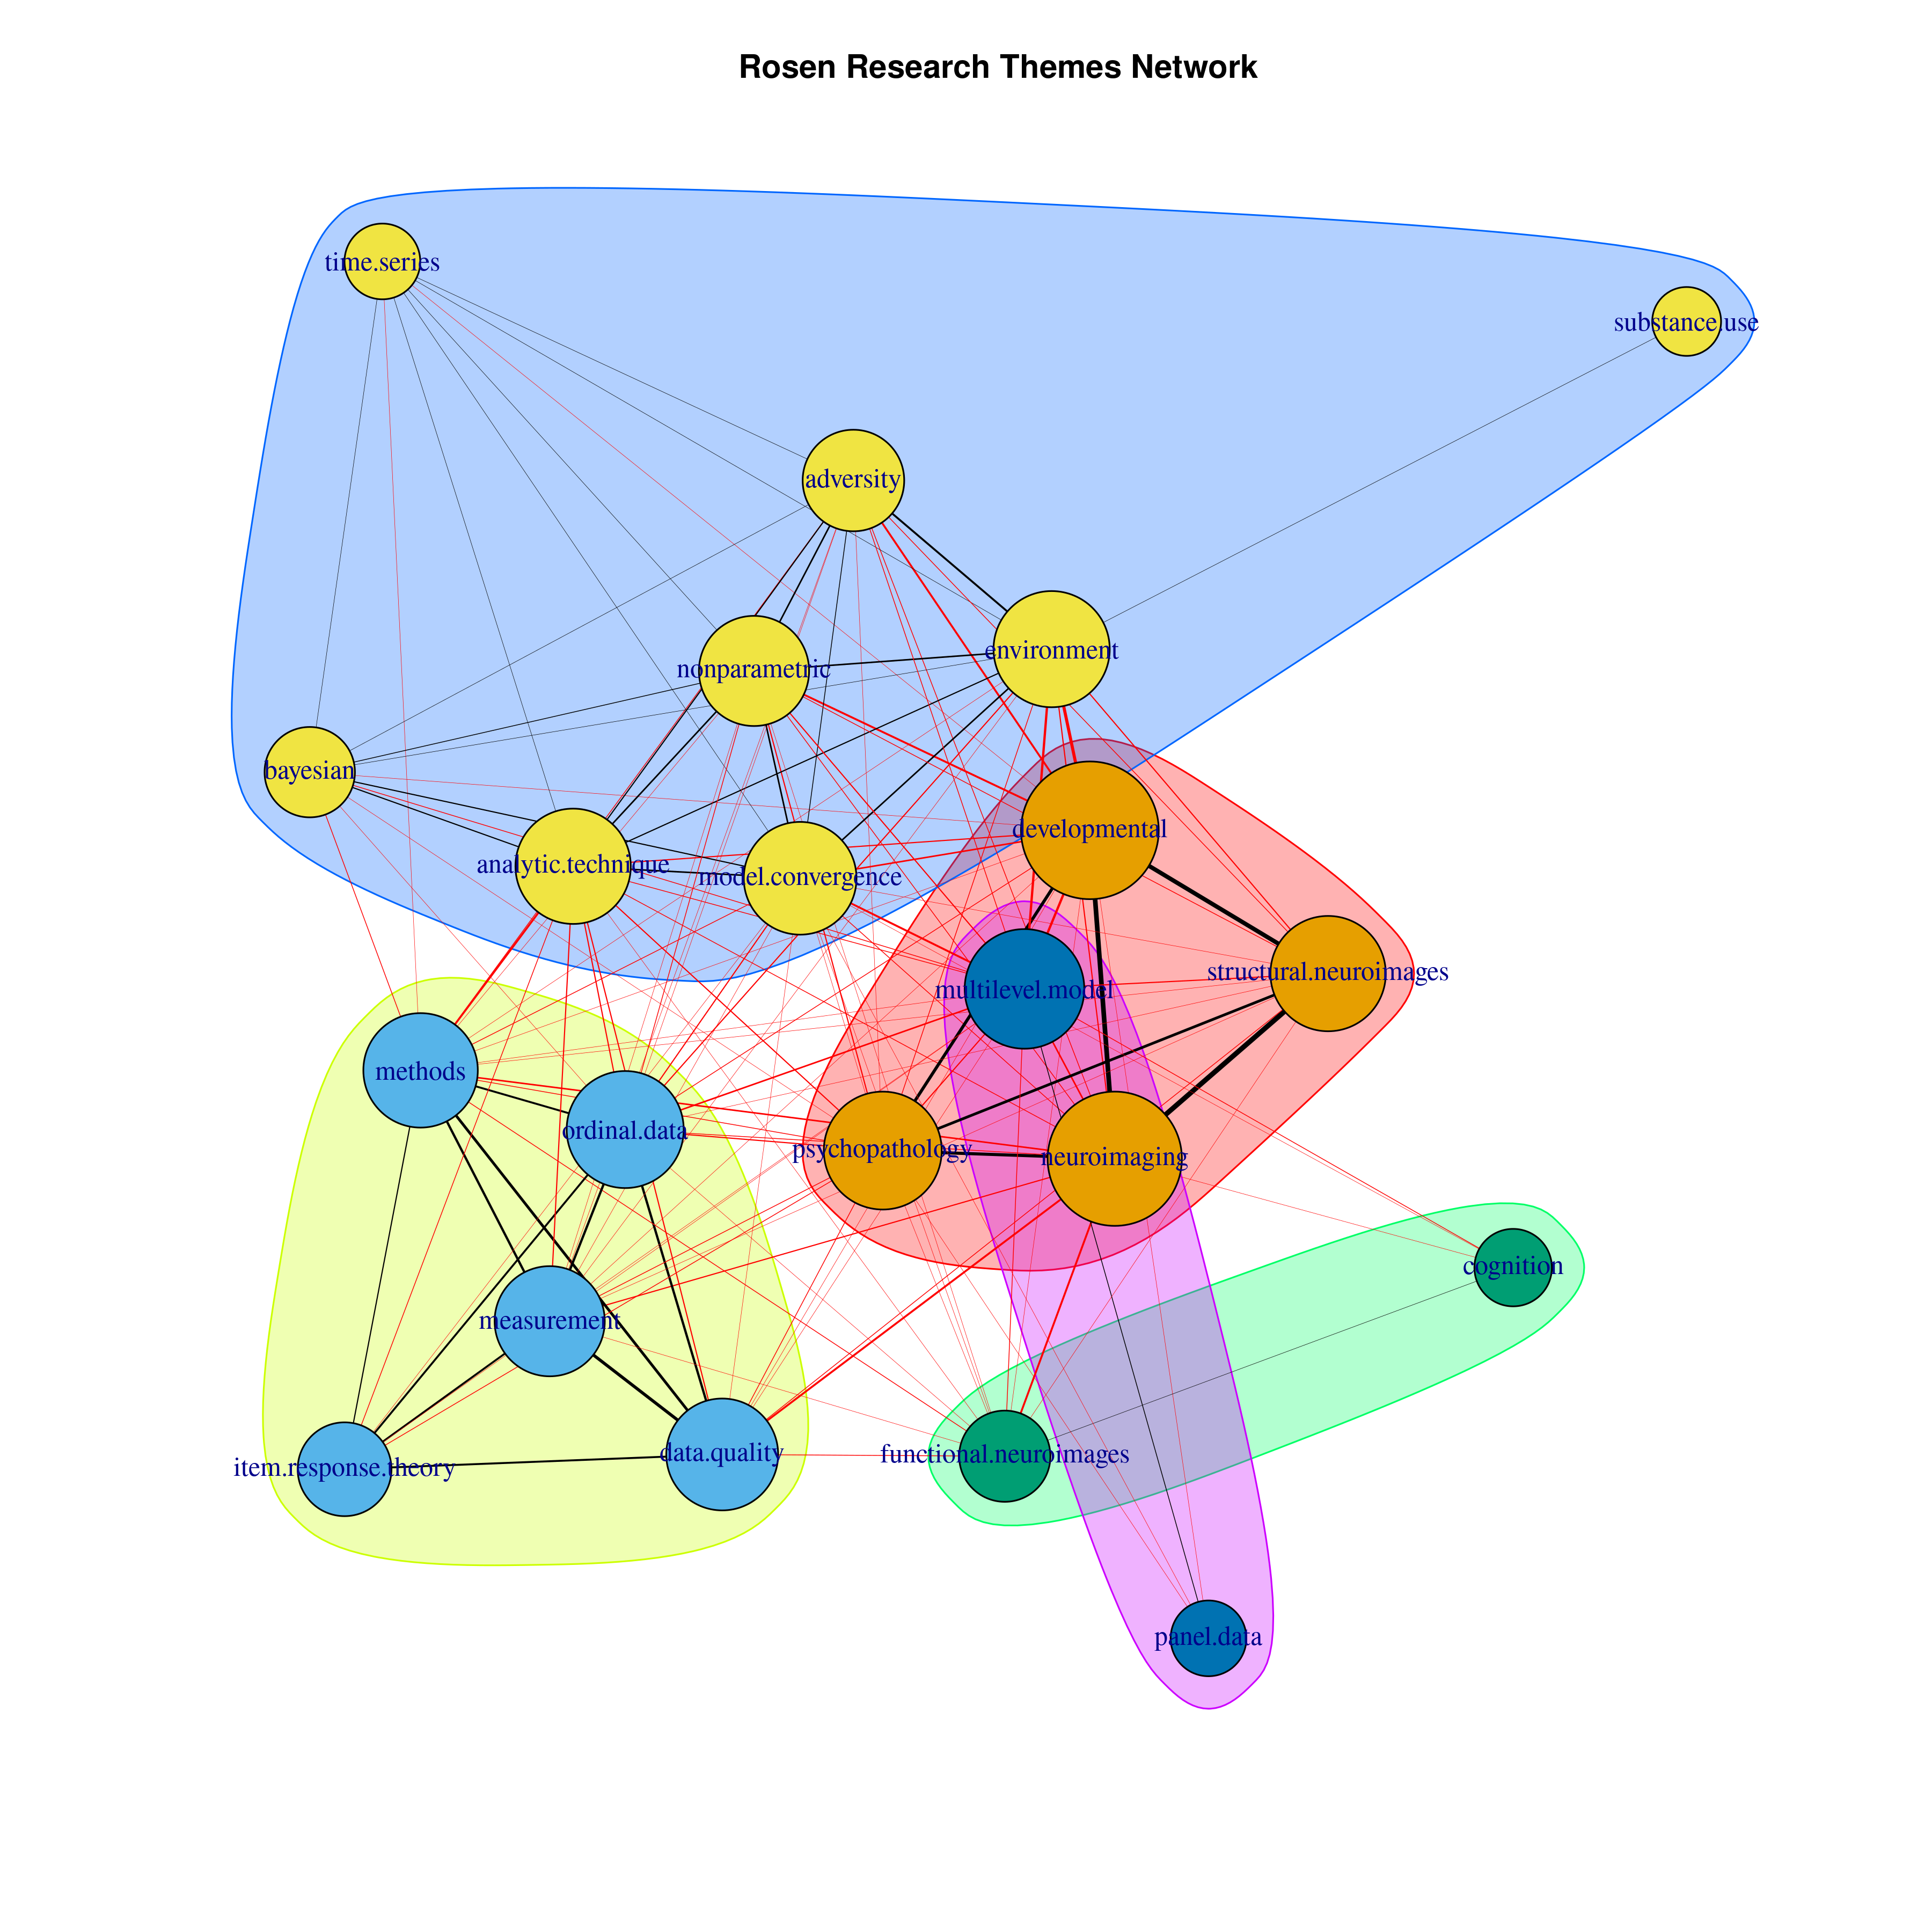 Above is the louvain clustering of these data.
And an interactive graph of these data can be found here